



TPRM
Third-Party Risk Management
A vendor flagged in screening with a COI disclosure tied to the same entity surfaces in your analytics without anyone building a custom report.
Learn moreGAN Integrity Platform
Lead your compliance conversation. Use AI Analytics and Dashboards and your connected data to tell the story.
This demo covers AI-assisted analytics and dashboard capabilities for compliance programs, including third-party risk management, conflicts of interest, self-service dashboards, custom dashboard creation, and board-level reporting using Stories.
Third-Party Risk Management: The third-party risk dashboard consolidates all TPRM data in one place. A Summarize feature generates an executive summary covering risk profiles, assessment status, and due diligence screening results. A Q&A feature accepts plain English questions and returns real-time analysis. Sample prompts appear based on current dashboard data to help users get started. Users can query vendor risk trends, program performance, and audit readiness. Example queries include breaking down third parties by risk level excluding unassessed vendors, and identifying where risk screening exposure exists across the supply chain. Results can be used to inform risk mitigation planning.
Conflicts of Interest Analytics: The conflicts of interest dashboard includes the same Q&A capability. Users can ask questions such as requesting a cost breakdown by conflict type. An example result shows a total conflict value of $15.7 million across all types, with consulting arrangements accounting for the highest proportion at just over $4 million. Users can follow up with more specific queries, such as requesting a risk breakdown within a specific conflict type. Results are returned as multiple graph and table views.
Self-Service Dashboards: Existing dashboard charts can be modified using natural language prompts without involving a BI team or submitting a support ticket. In a demonstrated example, an incidents chart is updated to group cases by workflow status and separate anonymous from non-anonymous submissions. New charts can also be created from a prompt and added directly to an existing dashboard for ongoing use.
Custom Dashboard Creation: New dashboards can be built from scratch using an AI-assisted workflow. Users navigate to Analytics Reports, select Analyses, and create a new analysis by choosing a dataset. They then describe the desired dashboard content in a natural language prompt, such as high-risk vendors by region or third-party risk posture this quarter. The system generates a complete set of recommended visuals based on the prompt and dataset. Users can adjust graph types, sheet contents, and datasets on screen before publishing. Published dashboards are built on governed compliance data already in the environment and are immediately ready to share.
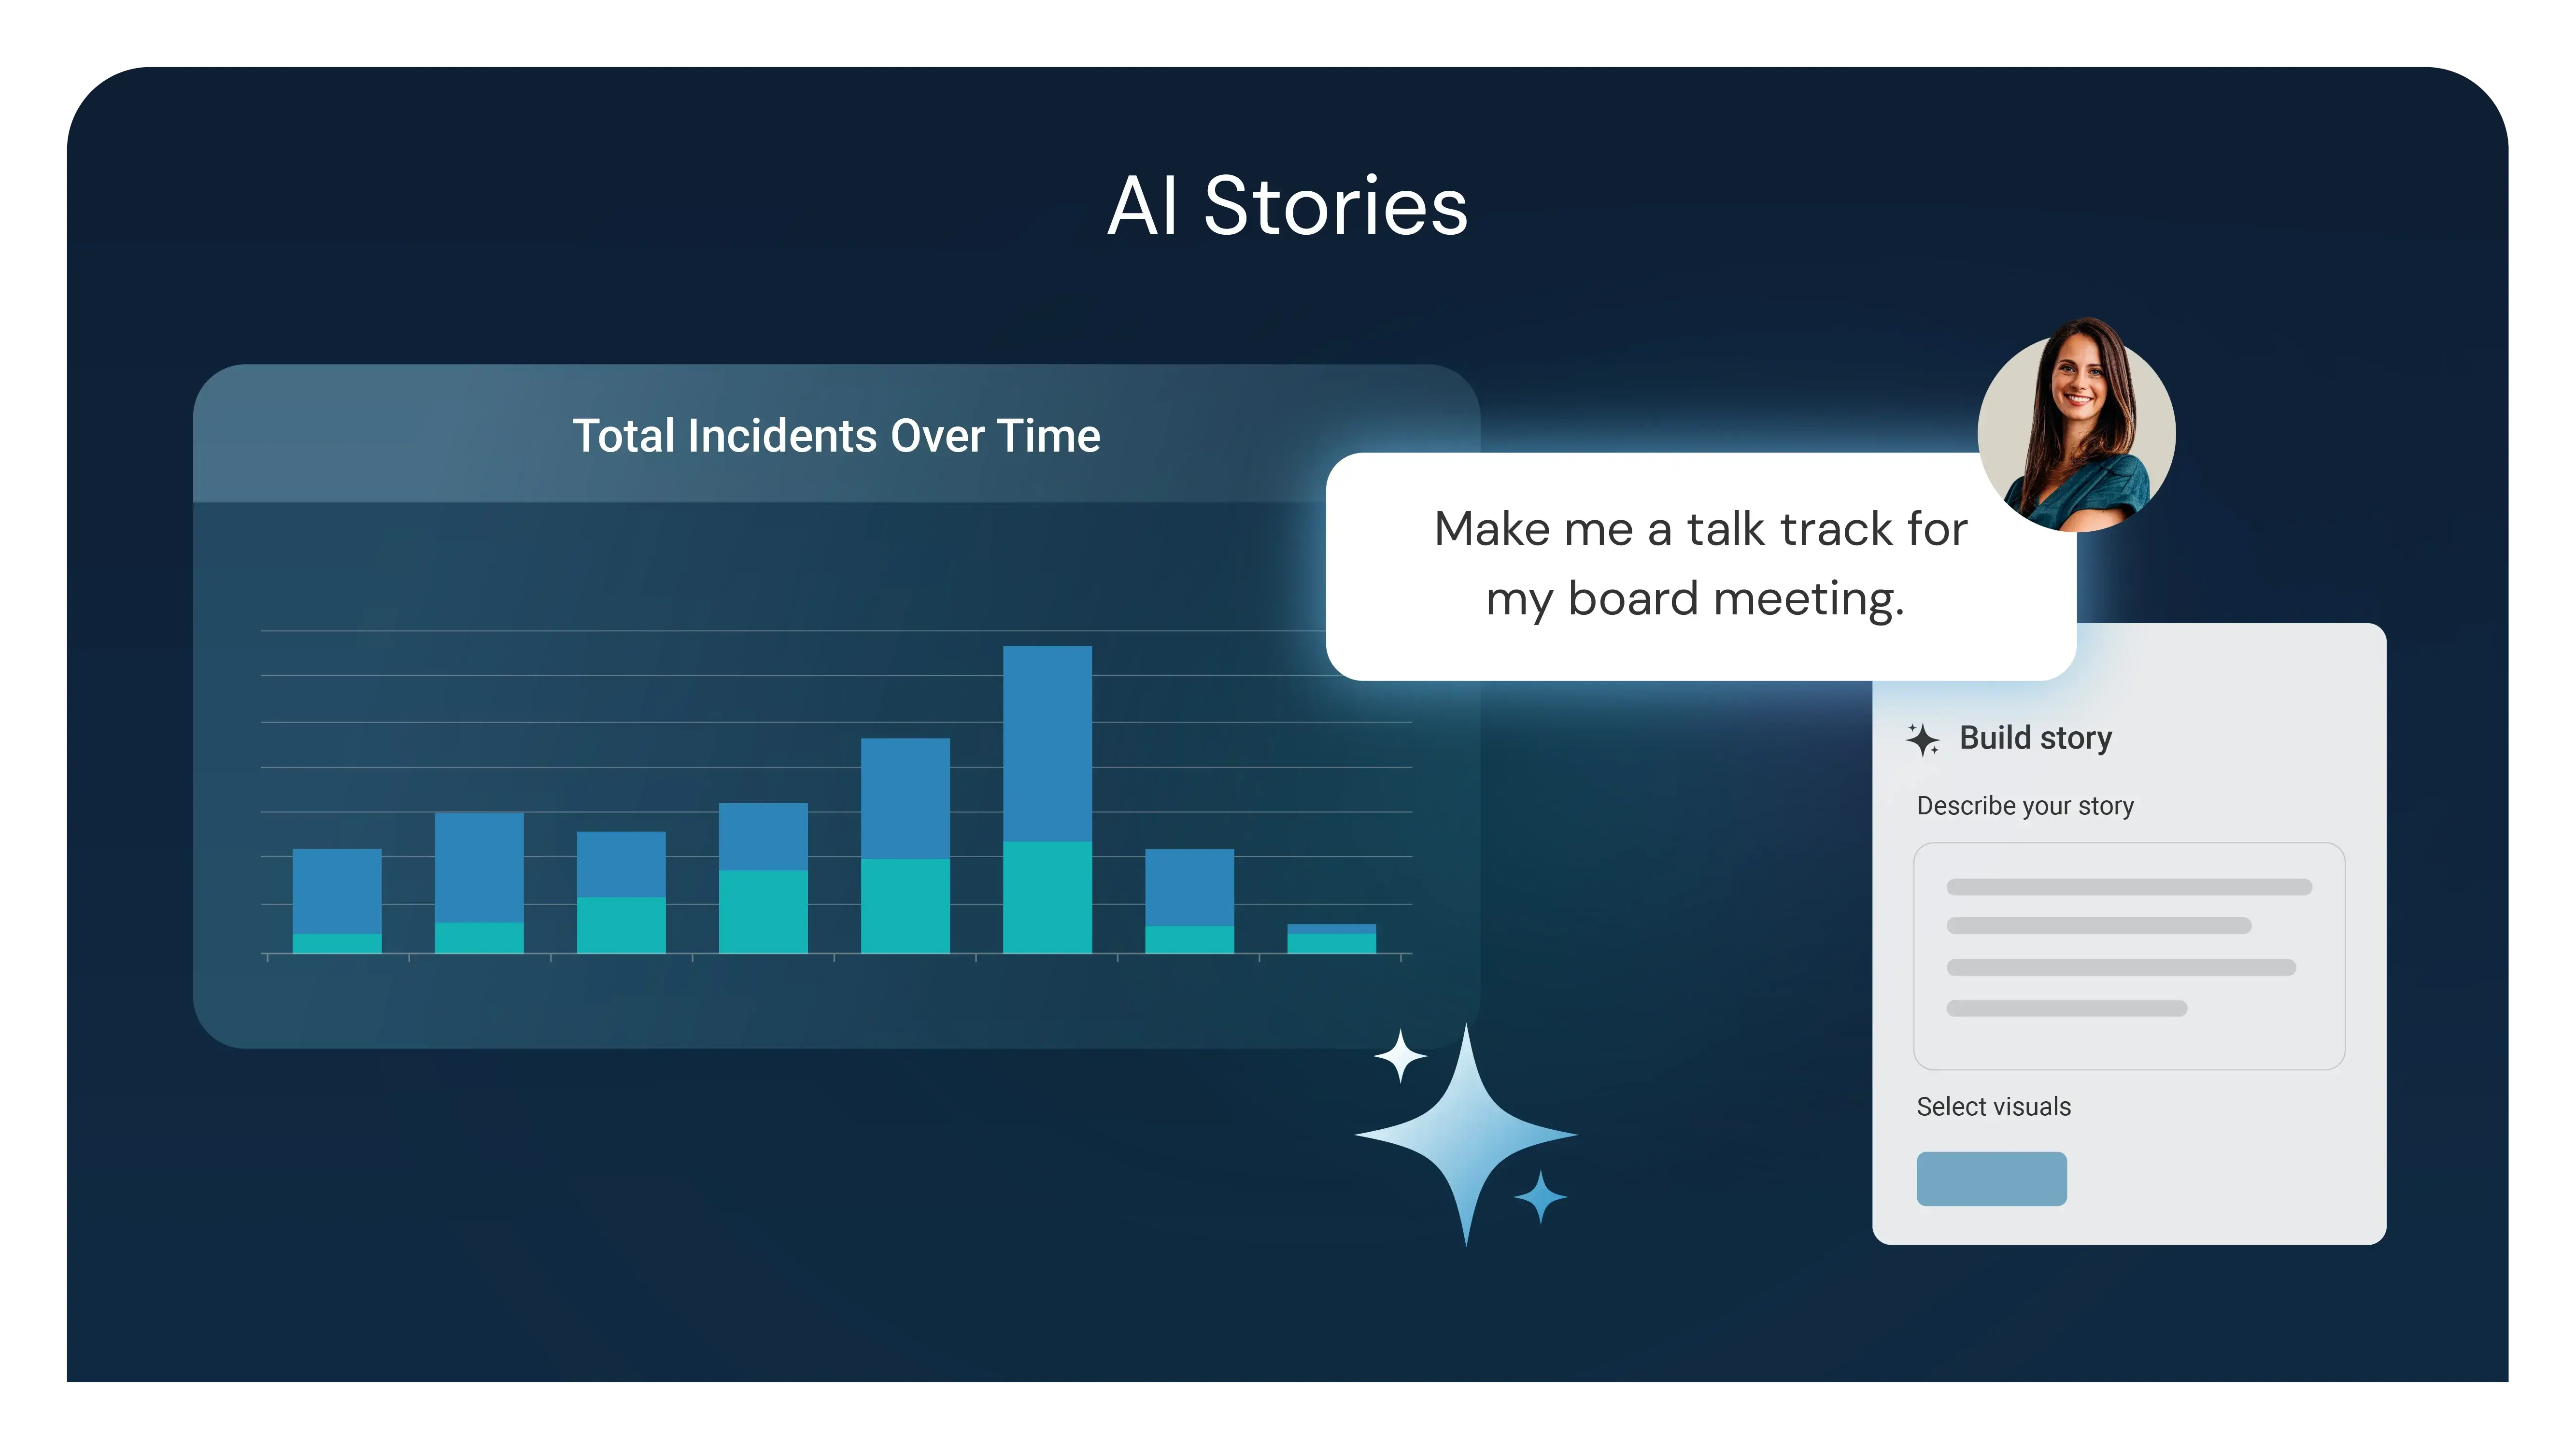
Stories: The Stories feature allows users to generate draft board and executive-level reports from existing dashboards. Users create a new Story by entering a prompt describing the report focus, then select specific charts for inclusion using checkboxes. The system automatically builds a draft report that can be reviewed, edited, published, and shared.
Trusted by compliance teams at global enterprises

Proven impact
Results from organizations around the globe
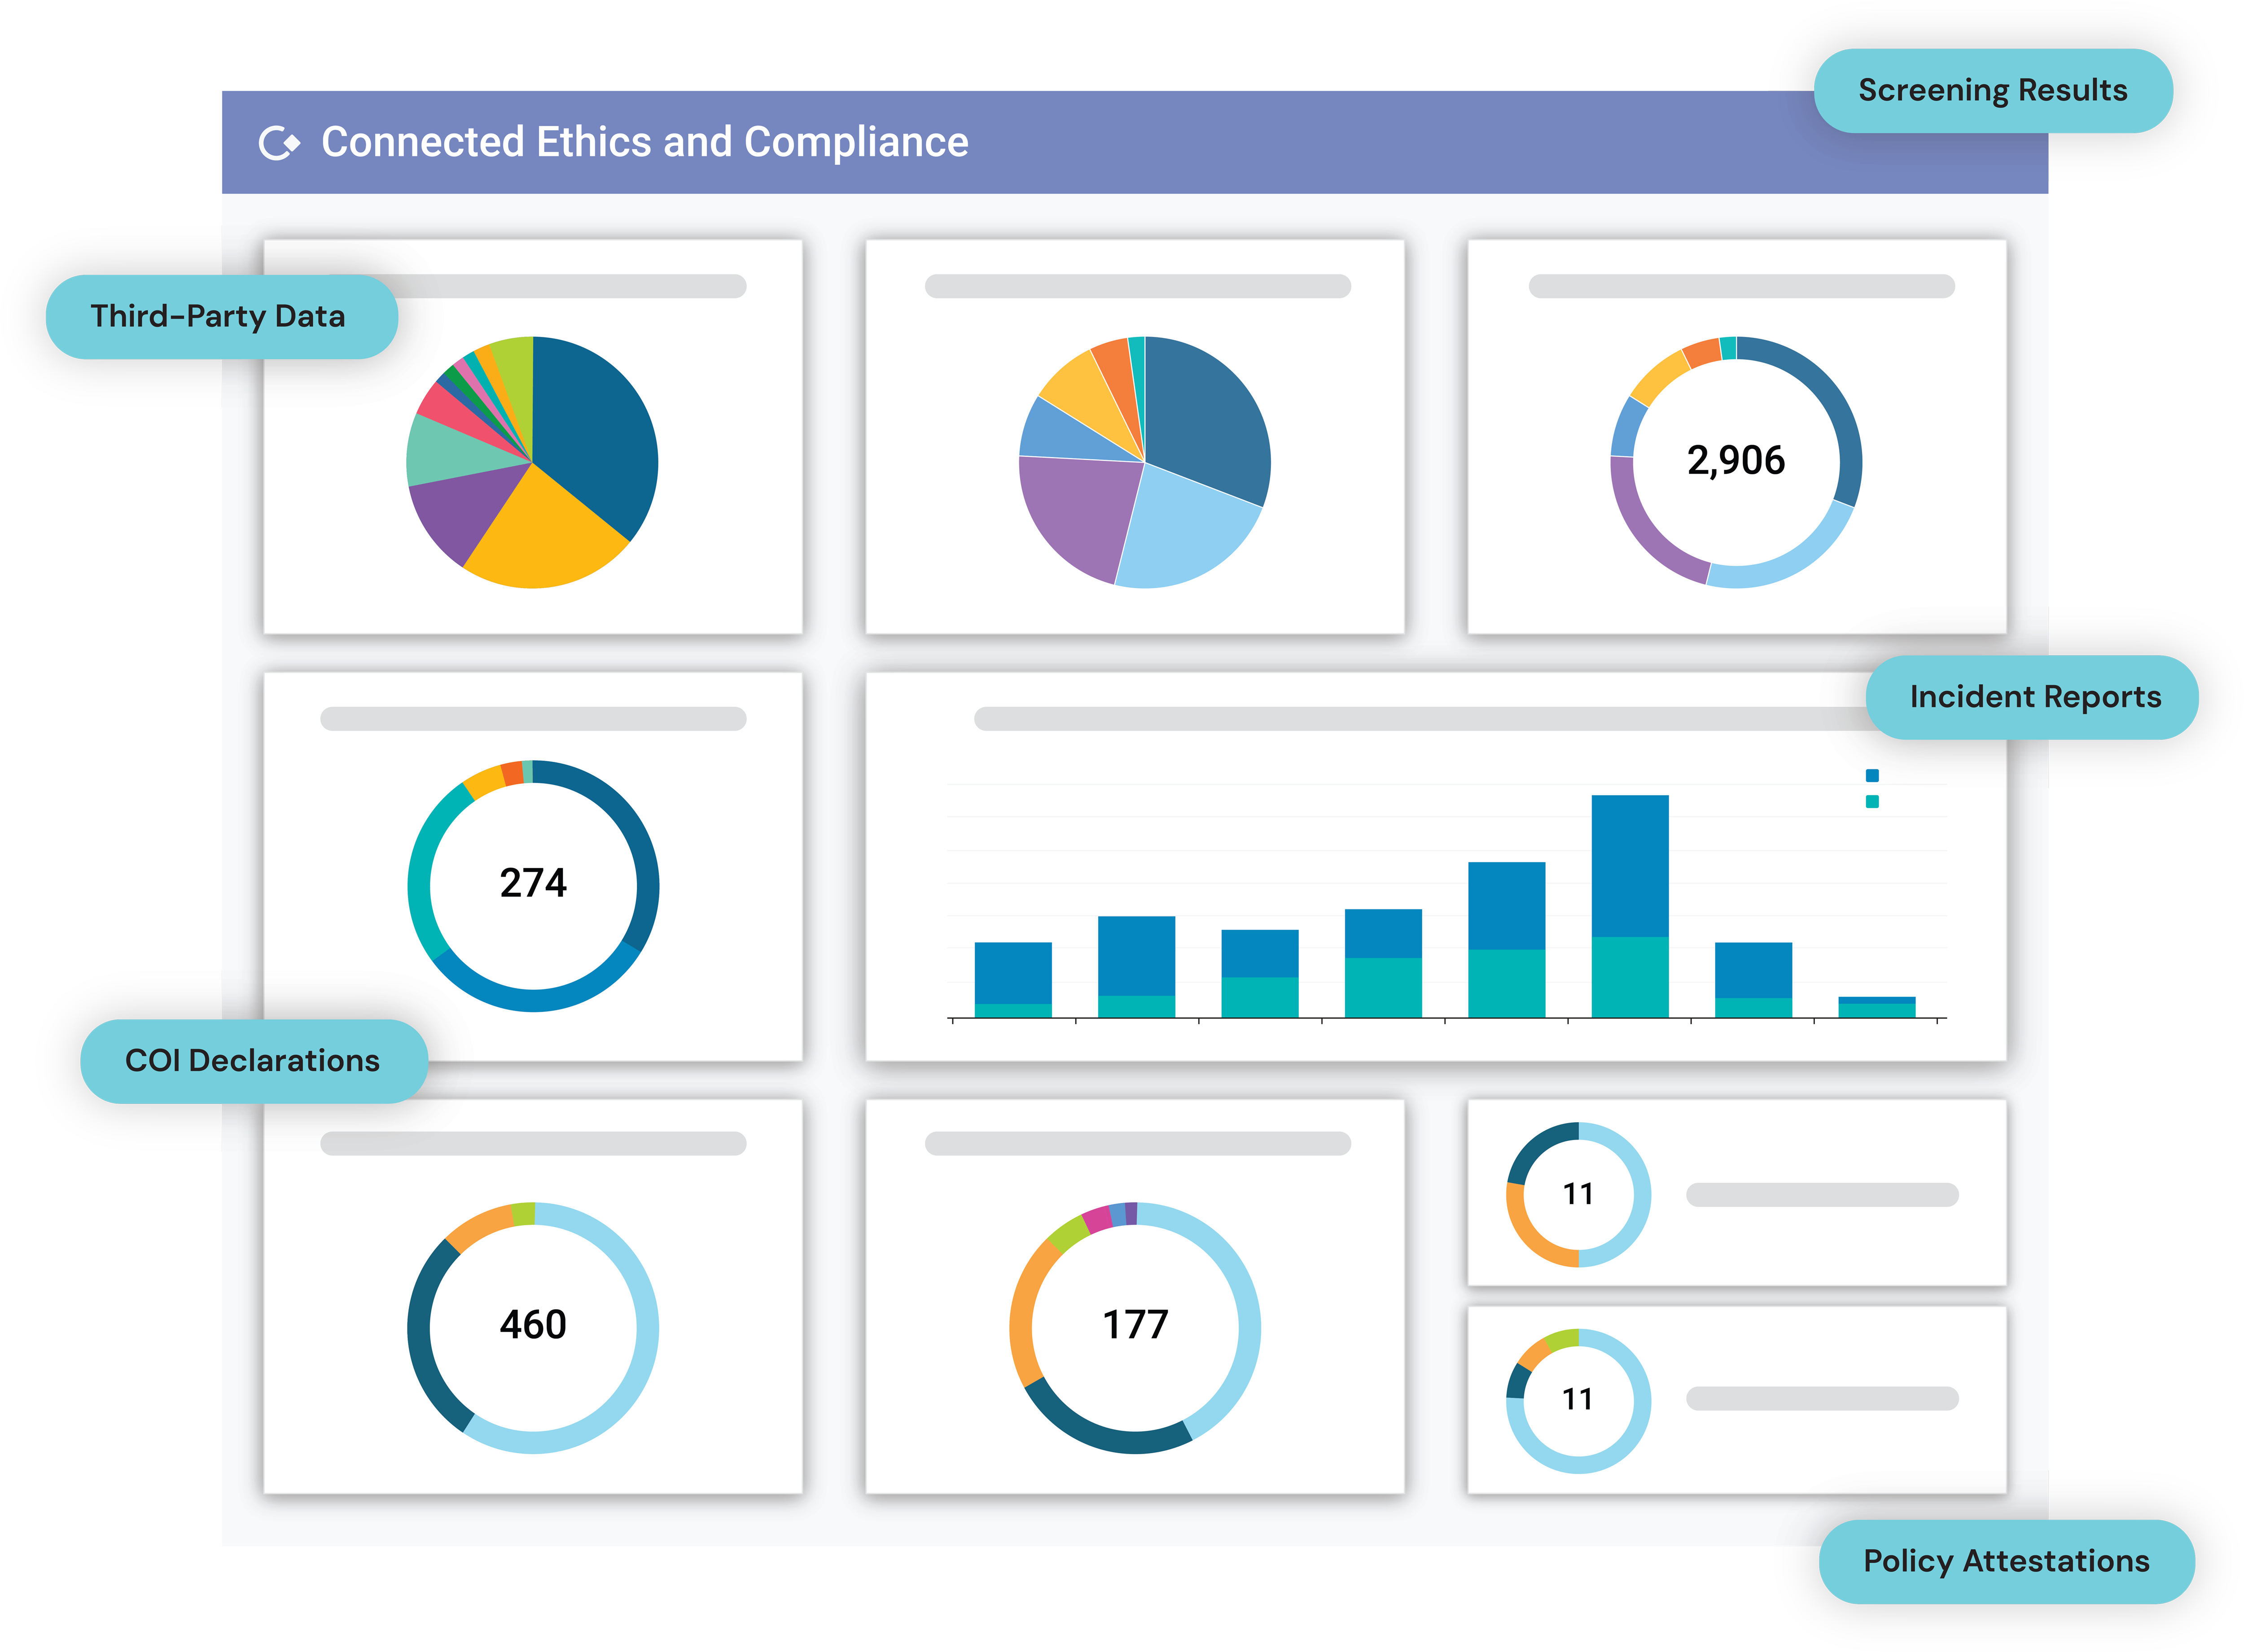
Every compliance platform generates data. It stays siloed. TPRM in one view, COI in another, incidents somewhere else. Producing a board update means pulling three exports, reconciling them in a spreadsheet, and presenting findings that are already two weeks old. GAN Analytics runs on a single data model that connects every program. The patterns that matter surface automatically.
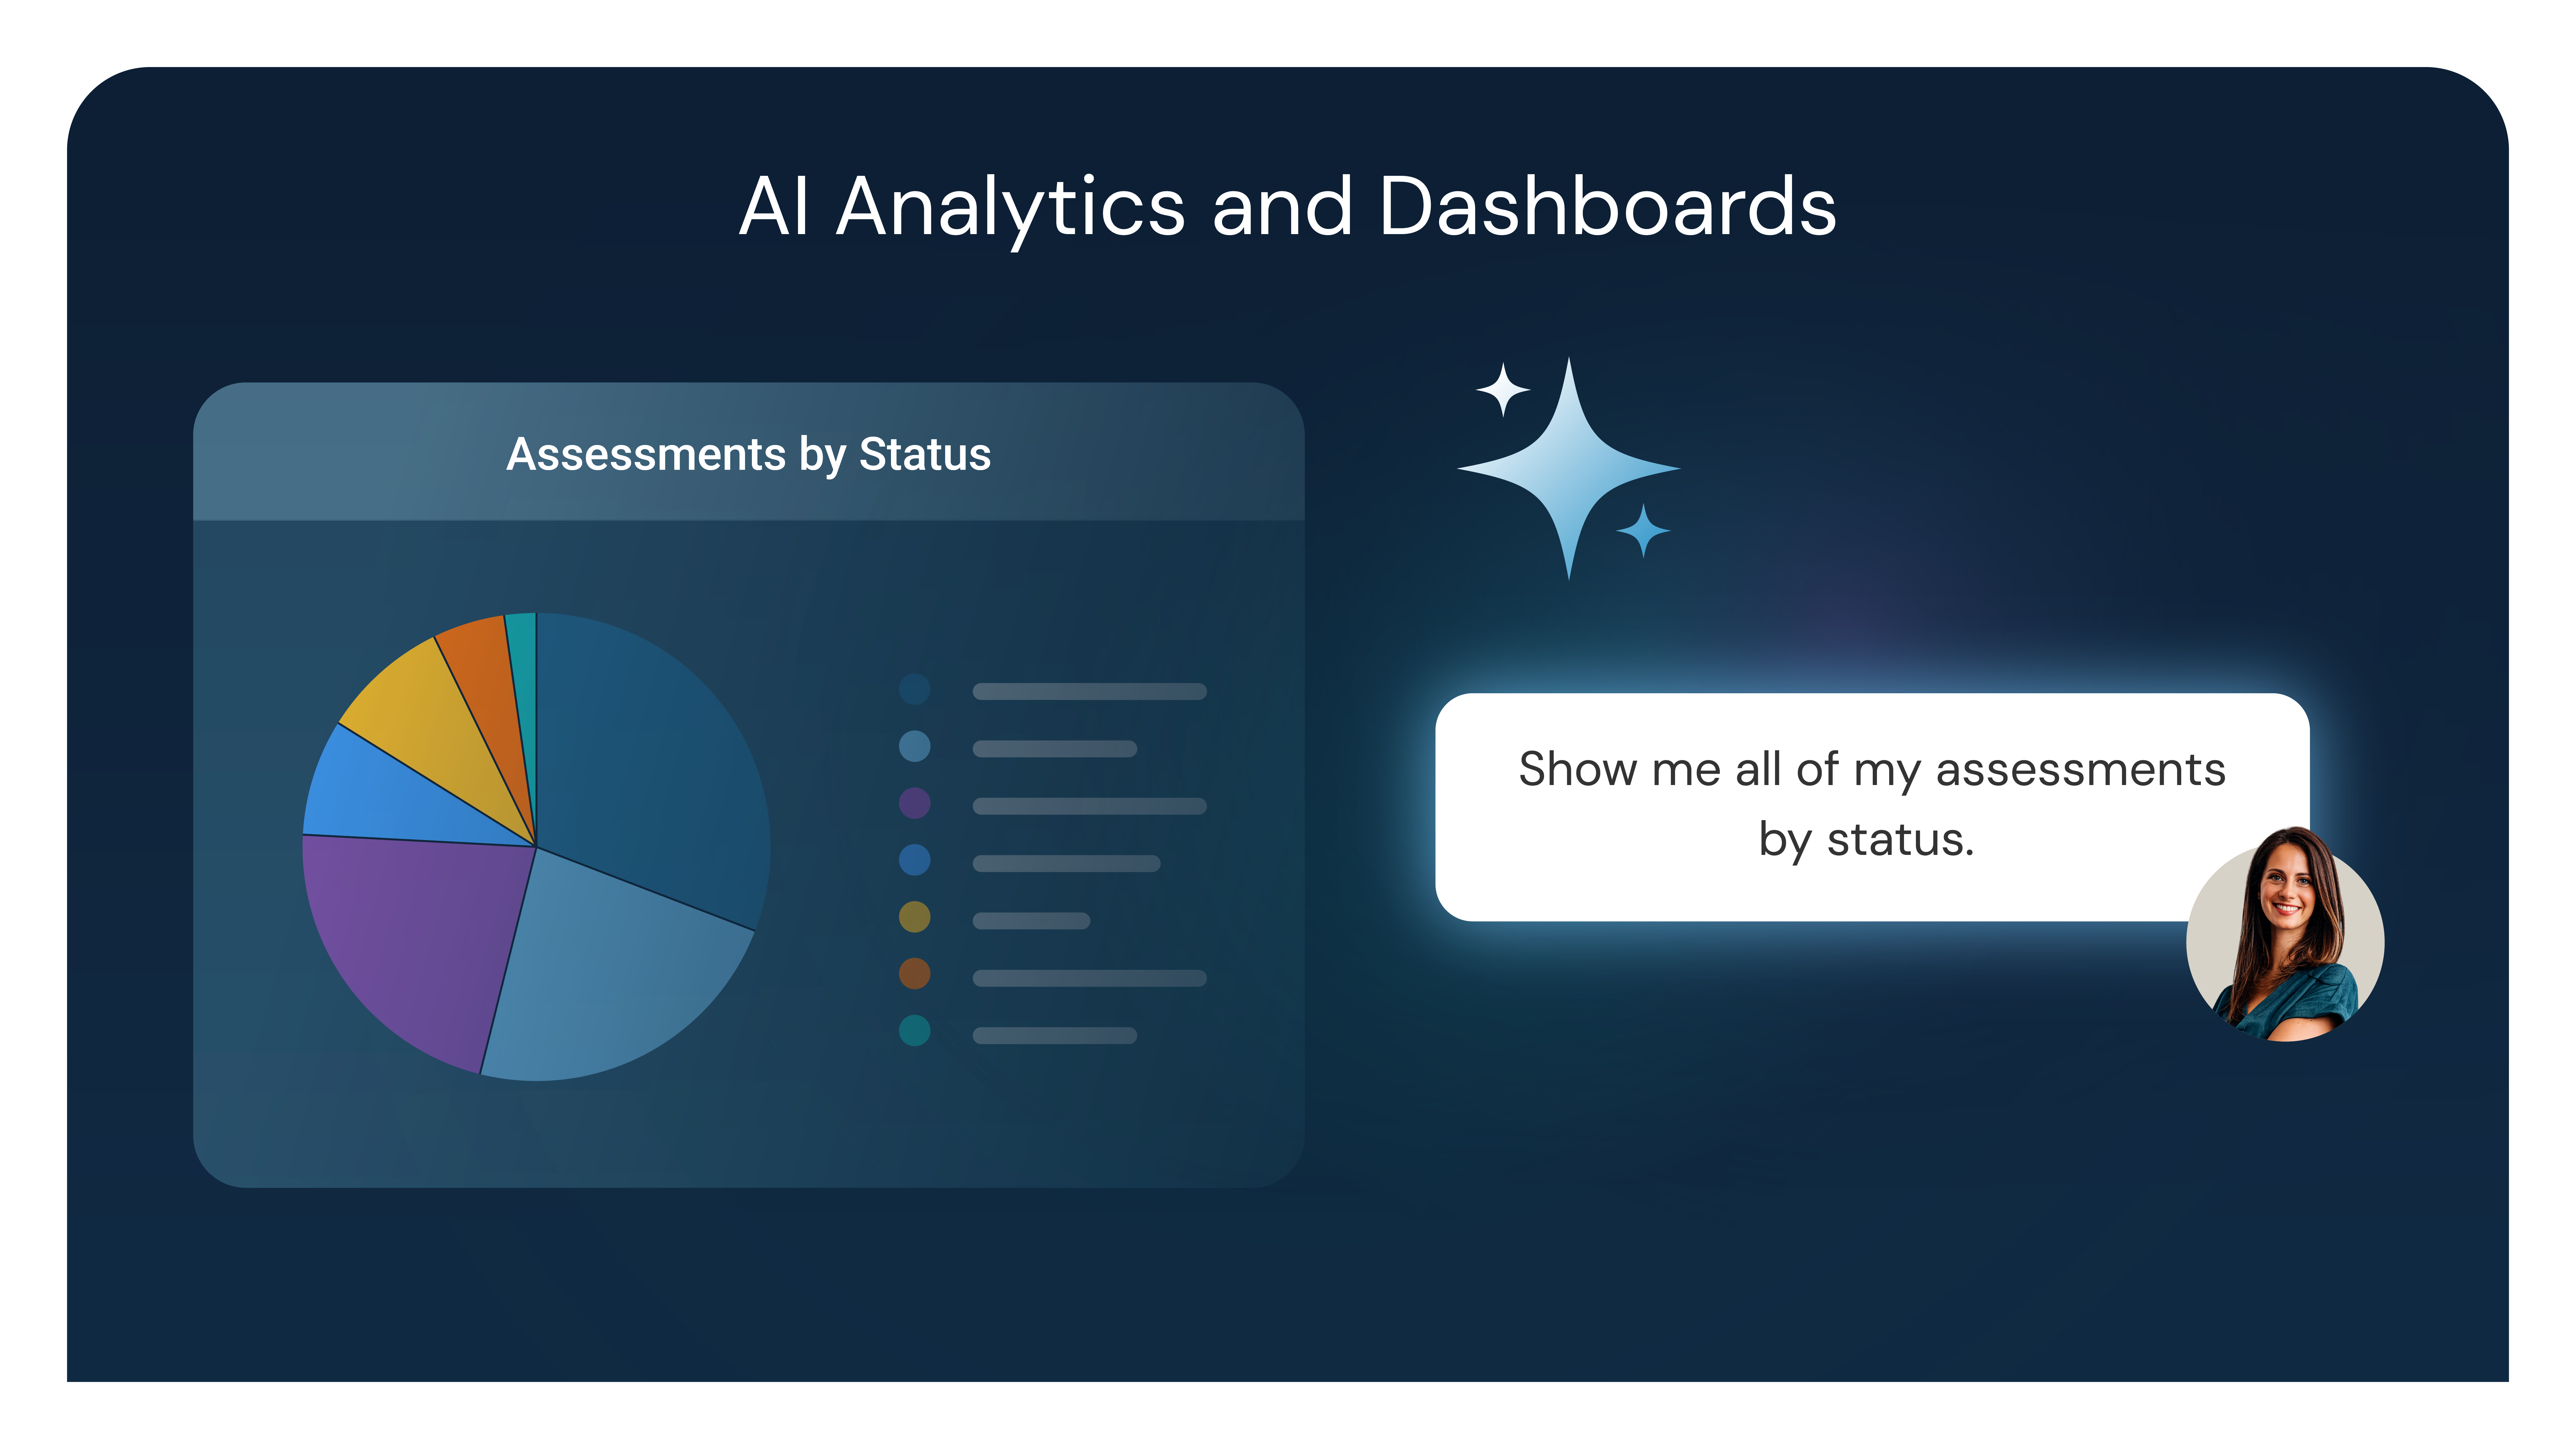
Ask the question. Get the dashboard. Your team self-serves reporting in moments, not days.
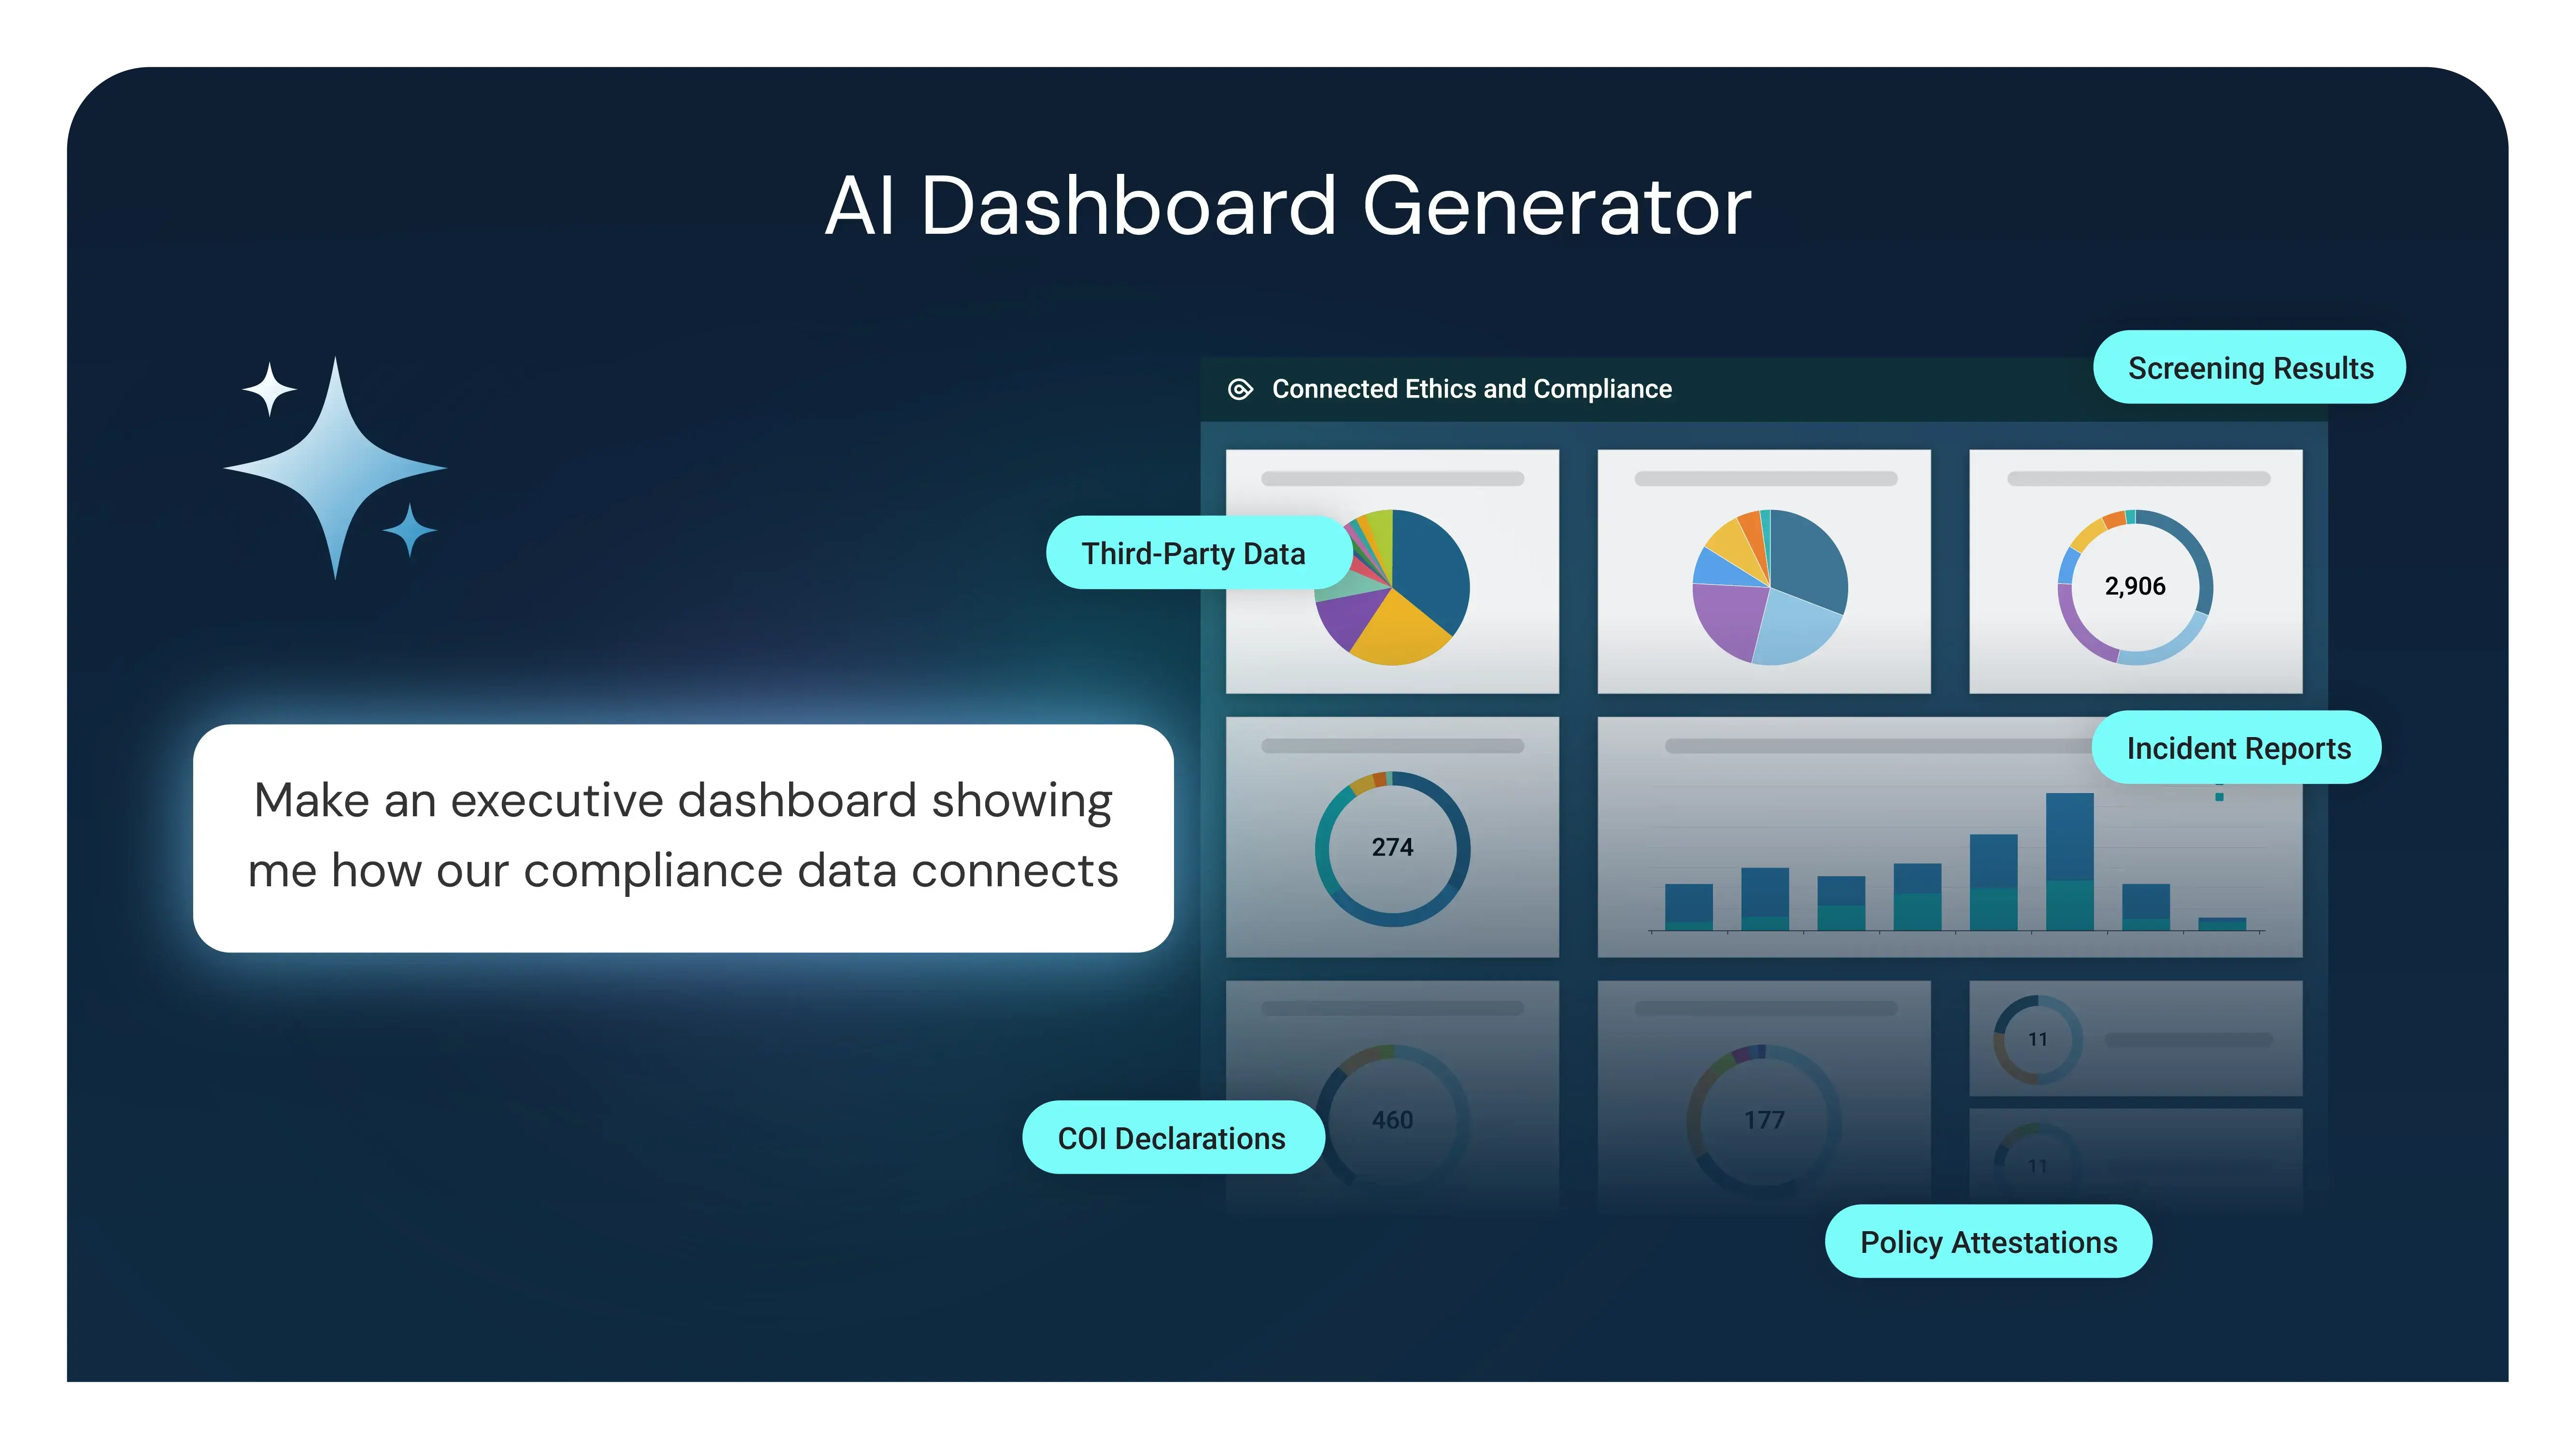
When the data is current and the narrative is already written, you walk into the board room with answers rather than updates. The questions you used to be concerned about are the ones you now invite.
See it in Action
Connected programs
A dashboard built on siloed data shows you what each program reports separately. GAN Integrity's AI Analytics runs on a single data model that spans your compliance program. The patterns that only appear across programs become visible automatically.
TPRM
A vendor flagged in screening with a COI disclosure tied to the same entity surfaces in your analytics without anyone building a custom report.
Learn moreDisclosures
Gifts trends by vendor, by employee, by business unit. Visible alongside the third-party and COI data from the same counterparty.
Learn morePolicy & Training
Attestation completion rates and policy gaps sit in the same dashboard as your risk and disclosure data. Low engagement that correlates with elevated risk becomes visible without a separate analysis.
Learn moreDisclosures
Donations that intersect with active third-party relationships or open COI disclosures surface automatically. Not after the fact.
Learn moreDisclosures
Every disclosure your employees submit sits alongside the vendor records, gifts data, and incident cases connected to the same people and entities. The full picture in one place.
Learn more“We use GAN for screening of suppliers as part of our onboarding and due diligence process - the risk environment can change fast e.g. new sanctions, emerging risks around data, AI and security, and the GAN reporting is a key part of our supplier risk management.”
Andrew Edwards Procurement, Royal Mail
Resources
Frequently Asked Questions
No. GAN Integrity's AI Analytics is built for compliance practitioners, not technical specialists. You can build dashboards, run queries, and generate board-ready outputs entirely on your own — in plain language, without any coding, SQL, or BI configuration.
Request a demonstration built around your compliance program.